Burn Day Status
July 5 - 7 - BACKYARD BURN SEASON IS CLOSED
-
Coastal
-
Inland
July 5 - 7 - BACKYARD BURN SEASON IS CLOSED
Coastal
Inland
Looking for Emissions Inventory downloadable forms? Click here.
An emissions inventory is a detailed list of emission estimates for air pollution sources associated with specific activities for a specific period. An emissions inventory provides information on the location, magnitude, and relative contribution of pollutant emissions in an air basin or county. The inventory is used by the San Luis Obispo Air Pollution Control District (SLO APCD) to attain clean air goals and ensure the health and wellbeing of San Luis Obispo County residents.
Emissions inventory quantifies emissions of criteria air pollutants in San Luis Obispo County. To protect public health and the environment, the United States Environmental Protection Agency (EPA) established national ambient air quality standards for six criteria pollutants: carbon monoxide (CO), oxides of nitrogen (NOx), oxides of sulfur (SOx), particulate matter (PM), lead and ground-level ozone (O3). Some of these pollutants such as CO, Lead, NOx, and SOx are emitted directly from a variety of sources. Ozone (O3) is not directly emitted but is formed when oxides of nitrogen and reactive organic gasses (ROG) react in the presence of sunlight. A summary of the relative contributions of criteria pollutants in San Luis Obispo County for the year 2018 is shown.

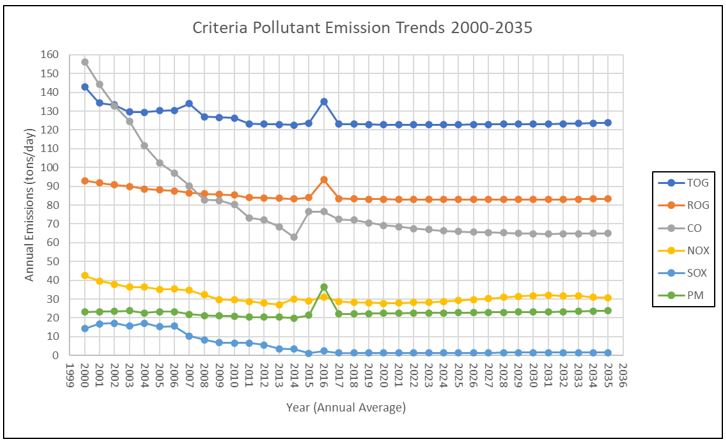
The California Air Resources Board (CARB) is responsible for the compilation of the final statewide emissions inventory. CARB has developed several tools for quantifying emissions in the State of California. The pollution mapping tool allows users to locate and view emissions of criteria and greenhouse gas (GHG) emissions from large sources in California. The tool provides an interactive platform to search facilities by name, location, or industrial sector and can be found here. CARB convened the State Implementation Plan (SIP) Inventory Working Group to develop a model to predict emissions of criteria pollutants from 2000 to 2035. Emissions of criteria pollutants from 2000 to 2035 in San Luis Obispo County is shown.
Contact us for more information on this topic.